Table of Contents
1. Introduction
2. Data Description
3. Data Analysis and Methodology
4. Data Analysis and Results
5. Discussion
6. Conclusions
7. References
8. Appendix
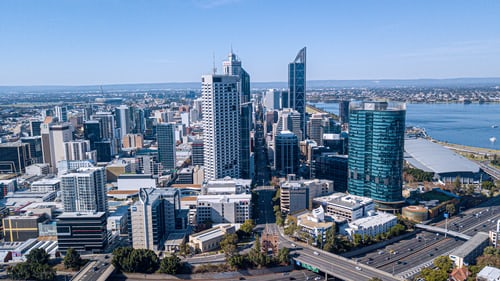
1. INTRODUCTION Western Australia
This report is part of the IBM Applied Data Analysis Capstone Project, through Coursera. Western Australia [1] has the highest GDP/GSP per capita of any state in Australia, for 2019/2020 this was ~110000 AUD. This GDP/GSP value also makes the global top ten GDP list if Western Australia where a separate country. Western Australia’s political stability, attractive Mediterranean type climate of hot summers and mild wet winters and a labour shortage makes the Capital City Perth a desirable location to move too in search of opportunity. Perth’s isolation and low population density has also helped control the spread of COVID-19. Apart from the occasional short lockdown, lifestyle is back to the normal pre 2020 level, almost.
Perth [2] is spread out along the Indian Ocean Coast from Dawesville to Yanchep, 121 Km (Haversine) [7]. The road transportation network is now well developed There are suburban rail and bus networks. The rail network is mainly used for workers commuting to the CBD. There are continuing developments in these areas including a rail link to Perth International airport; and extensions of the Mitchell Freeway and Tonkin Hwy to the North of the city which is likely to promote further suburban development.
The rapid growth of Perth and Western Australia since the discovery of iron ore in the Pilbara in the 1950s has resulted in considerable opportunity not only in the mining industry but throughout the state. Western Australia is also a significant gold and agricultural producer and is one of the great grains growing areas of the World. The hazards and the remote locations of most of the mines has produced a “fly in fly out” FIFO culture which is very well paid. I have personally heard people who have worked and are working in the mining industry boasting of pay off their family home mortgages in 3 years? The rapid growth of the suburbs has resulted in the shortage of amenities and hence opportunities for business. For, example when I was living in Aveley in 2011, I could only find one petrol station in the entire Ellenbrook/Aveley/The Vines area; these suburbs have a combined population of over 60000.
2. Data Description
Summary
The methodology to provide information that businesses, contractors, and employees can use to make decisions uses a combination of suburb geolocation data, venue information using the foursquare API, an unsupervised machine learning algorithm K-means clustering for clustering similar suburbs with similar venues and attributes, and median house price data for randomly selected suburbs. A multiple linear regression analysis will attempt to build a model to predict house median house price data based on distance from the coast and distance from CBD. Methodology described below.
3. Data Analysis and Methodology
The geolocation data was obtained from corra.com.au [6]. This data was then wrangled in Excel to create a file of only the Greater Perth suburbs and uploaded to the IBM cloud Watson Studio site and converted into a Pandas data frame (Figure 2) in a Python 3.7 Jupyter Notebook [8]. The python packages, for example, pandas, matplotlib, and folium were already imported. The mapping package folium was used to display the Perth suburbs on a Map (Figure 1, below). The foursquare API was then used to access venue data from the different suburbs [4, 5, 9]. One hot encoding was then used because machine learning algorithms cannot work with categorical data directly. The top venues categories for each suburb were grouped and then displayed in a data frame (Figure 3). This data frame was then used to cluster similar suburbs by K-means clustering and the result presented in a folium generated map (Figure 4, Figure 9 Appendix). This included a list of all the suburbs and what cluster they were in (Figure 5). K-means clustering was chosen because it is easy to implement with new examples and the data set was relatively large at over 300 suburbs. In addition, the algorithm chosen was required to group similar suburbs for comparison or “The Battle of the Neighbourhoods” there was no dependant variable involved hence unsupervised learning. K-means clustering can also be used in exploratory data analysis “to point the way” [4, 5].
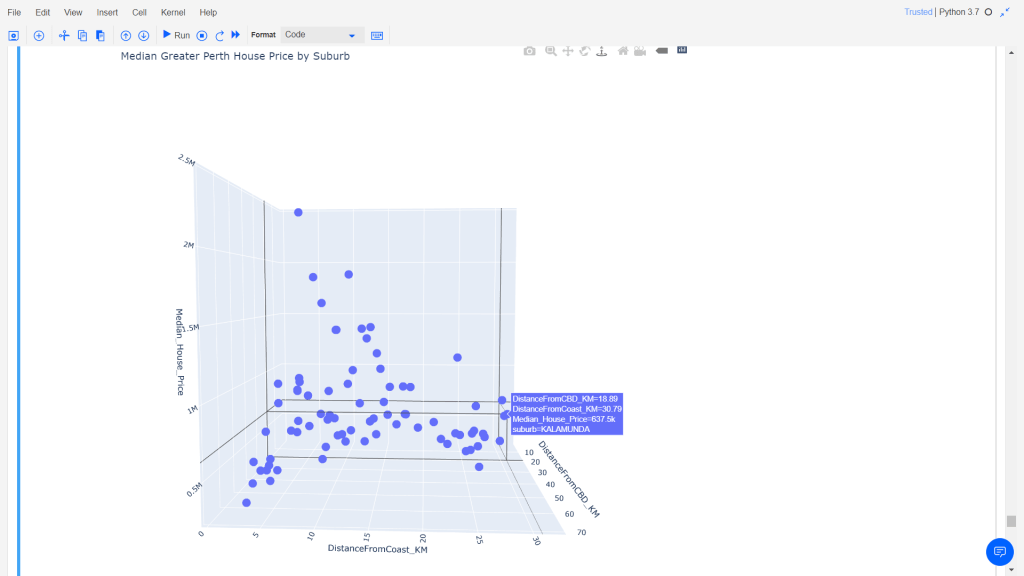
A multiple linear regression plot was developed of two independent variables, distance from CBD, and distance from the coast, to potentially predict the median house price of the different suburbs (dependant variable). A sample of the Perth suburb geolocation data (n=79) was taken randomly (random number generator) and a new pandas data frame was constructed with the median house price data (Figure 6). These distances were calculated from the geolocation data for the different suburbs by a haversine calculation. The haversine program used to calculate these distances was checked with known data [7]. The real estate median house price data was obtained from RealEstate.com.au [3]. The R^2 value was calculated for the multiple linear regression plot and 3D plots were generated using matplotlib and PLOTLY Express (Figure 7)
4. Data Analysis and Results
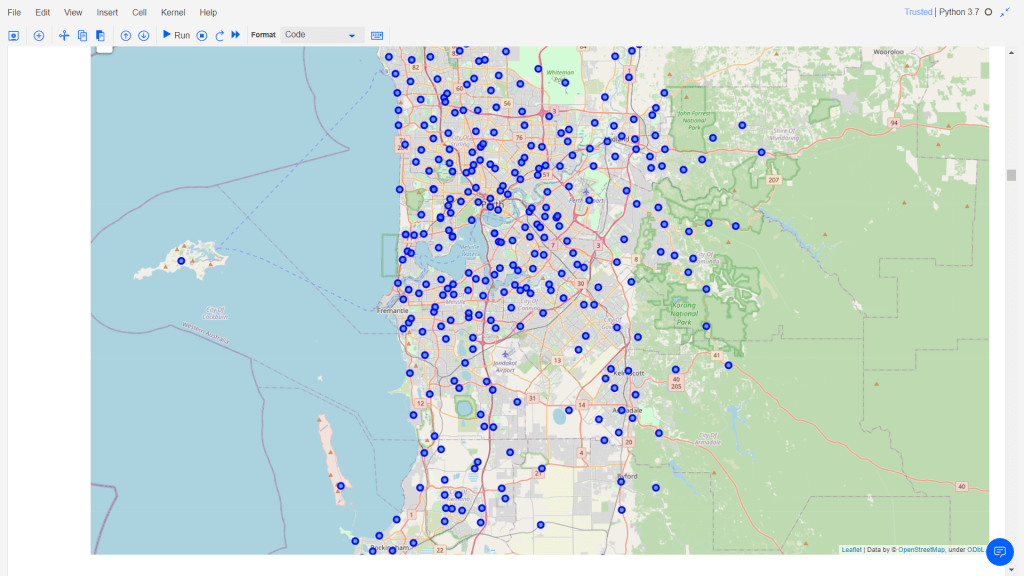
Figure 1. (ABOVE) Folium generated map of some Perth Suburbs from Geolocation data

Figure 2. (ABOVE) Pandas Data Frame of Geo Location Data for Some Perth Suburbs
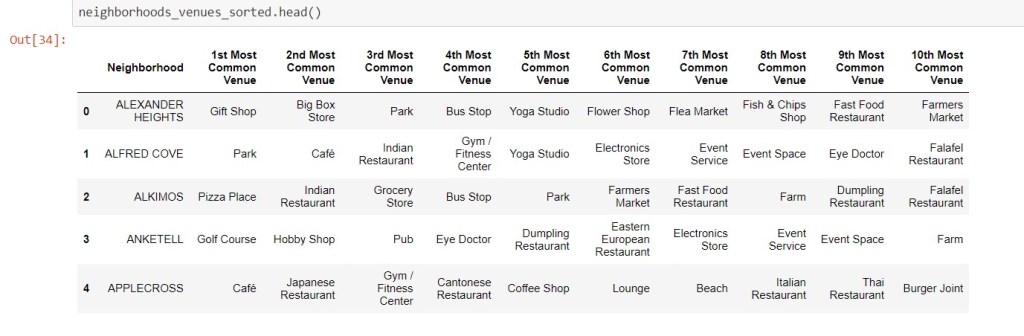
Figure 3. (ABOVE) Pandas Data Frame of most common venues for some Perth Suburbs

Figure 4. (ABOVE) K-means clustering (K = 5) of Perth Suburbs (Neighborhoods) in the vicinity of Perth CBD
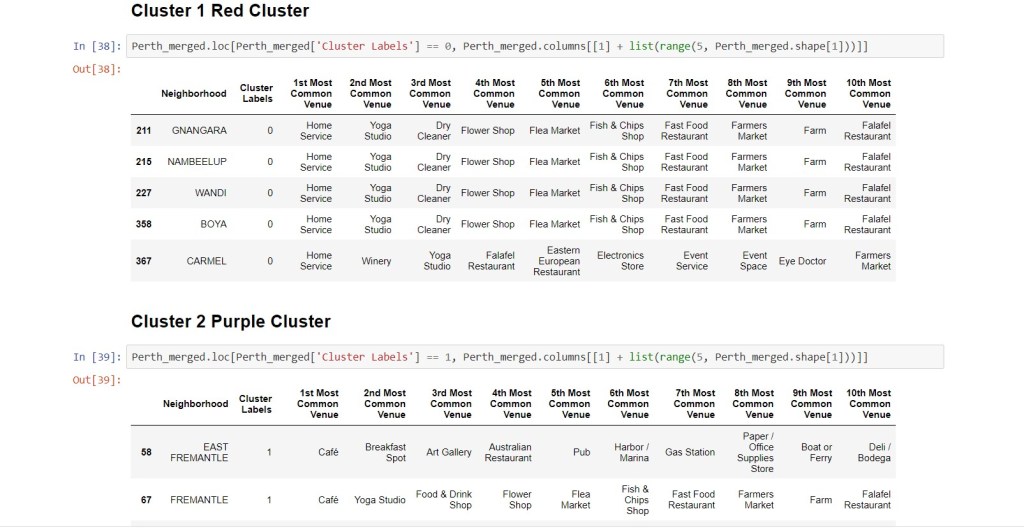
Figure 5. (ABOVE) snip of cluster lists for Figure 4.
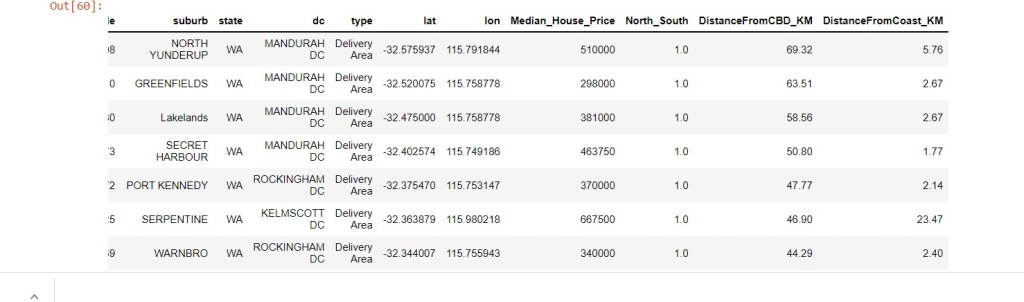
Fig. 6 (ABOVE) & Fig. 7 (BELOW) Housing Price and Location Data for Suburbs

The K-means clustering algorithm with the K value = 5, produced some useful information and grouped suburbs with similar attributes well. This program was run on multiple occasion and gave slightly different results each time. However, this can possibly attributed consumer changes throughout the week. The results were considered satisfactory (Figure 5) so no other K value was used.
North and South of the River Swan (Figure 3 and Figure 9 Appendix)
Most of the light industrial areas I have found listed are south of the Swan River apart form, Bayswater, Osborne Park, Malaga, Joondalup, Wangara, Balcatta and Neerabup. This reinforces the idea that North of the Swan River is more suburban than the South. South of the “River” has a well-developed road system including the Kwinana Freeway and the Roe and Tonkin Hwy’s, especially the Roe Hwy, give quick transport time between suburbs that are not close to the CBD and are easily accessed from most suburbs. Traffic snarl ups around the CBD during rush hours are to be avoided so if your job or business or contracting business is North or South of the River it is advised you live there as well. Obviously, if you work in the CBD it is best you have the option of catching a train to work; this also expands your options of where to live.
Neighbourhoods South of the River
The suburbs south of the river are generally grouped into four areas. Most of the suburbs are in a triangle from Fremantle to Maddington and Gosnells plus North to Belmont. There are groups of suburbs around the cities of Armadale, Rockingham and Mandurah. Armadale is not recommended as a place to live. The commute times are longer in Mandurah. The first group mentioned has the highest price suburbs, which also have the most amenities so if you can afford a house here live here, for instance, Applecross has food outlets or restaurants in the top 6 venues including a Japanese, Mediterranean and an Italian Restaurant. There are cheaper suburbs such as Gosnells and Maddington, these will be discussed below. This leaves Rockingham and Kwinana (most suburbs in cluster 2). Apart from Eastern European Restaurants and Falafel Restaurants, there appears to be no other ethnic eateries in the top 10 venues in the Rockingham Kwinana area (Appendix, Figure 9). They do exist since I have seen Asian food offered in the Council Street shopping complex in Rockingham. Falafel Restaurants appear to be everywhere in the Greater Perth area. The top food outlets seem to be of the fast-food variety. Baldvis which is a rapidly expanding area, after a fast-food outlet, the top venues are a department store and a hardware store. Therefore, a good place to buy a house and get set up; Baldvis (Appendix, Figure 9) is also close to the Kwinana Freeway.
Maddington and Gosnells which have median house prices of 335000 and 320000 respectively are just two of the cheapest suburbs for housing price south of the river and closer to the CBD, they also have train stations. Maddington is the better choice it has a sandwich place and Dumpling Restaurant in the top 10 venues which is a good sign, while Gosnells has a liquor outlet as the third top venue which is a bad sign. While talking about liquor out lets the suburbs which have them in the top 10 venues are –
Merriwa, Marmion, Gosnells, North Beach, Scarborough, Pinjarra, High Wycombe, Gooseberry Hill, Como, Manning, Bently South, Mount Pleasant, Kwinana Town Centre, Melville, Duncraig, Kelmscott, Forrestfield, Kenwick, Noranda, Karawara, Bull Creek, Betram, Baldvis, Willagee Central, Coolbelup, Innaloo, Padbury and Beldon. (11/7/2021) [10]
Melville, West Leederville, Duncraig, Mount Pleasant, Como, Marmion, North beach, Padbury, Wembley Downs, Colbellup, Bertram, Carlisle North, Carlise, Kelmscott, Merriwa, Beldon
South Fremantle, Cottesloe, Peppermint Grove, Wannero, Willagee Central, South Lake, Shelley, Parkwood, Bassendean, Gosnells, Forrestfield, High Wycombe, Middle Swan, Gooseberry Hill, Pinjarra (12/7/2021) [8]
All these suburbs are in clusters 2 and 3 for the 11 July and in cluster 2, 3 and 4 on 12 July. For the 11 of July the two suburbs with liquor stores as the top venue are Mount Pleasant and Kwinana Town Centre, both in cluster 3. For the 12 July the four suburbs with liquor stores as the top venue are Mount Pleasant, Cluster 2, Pinjarra and Shelley, Cluster 4 and Wembley Downs, Cluster 3. Finally, Midland, which has one of the lowest median house prices in Perth and surrounds should not be ignored. Midland is close to the Swan Valley wineries and has Japanese and Asian Restaurants in the top 10 venues also a steak house and Movie House. Midlands most famous son.
Neighbourhoods North of the River
The far northern suburbs of Perth appears to be where most of the urban development is especially with the extension of the Mitchell Freeway. These suburbs have sprung up rapidly and maybe short of amenities found elsewhere. The suburbs on the coast like Scarborough, Cottesloe, Hillarys and Ocean Reef have expensive real estate. For instance, Hillarys has a medium house price of 900000 AUD. The adjacent suburb away from the coast, Padbury, has a medium house price of about 555000 which is more reasonable. Both these suburbs are in Cluster 2. Hillarys has a supermarket and a shopping mall as the top venues while Padbury has a Pizza place and a fast food restaurant. Hillarys has a marina as does Ocean Reef further North, which is still under development, median house price 775000. The North of Perth is slightly warmer during winter than the southern suburbs and is warmer than the southwest. This is balanced by the fact of having personally seen snakes warning signs on beaches in addition to warnings about rogue waves. This should be checked on a suburb-by-suburb basis. Portugese man o’ war or bluebottles can also be found washed up on some of the beaches. Further Inland, the Ellenbrook, Vines, Aveley group of suburbs in the Swan Valley is worth mentioning. Ellenbrook has a Thai, Eastern European and Chinese Restaurants in the top 10 venues with a park being the top venue. In addition, there are also wineries in the Swan Valley. The Ellenbrook medium house price is 395000 AUD. These suburbs are now well serviced by road, and it is easy to drive to the coast via the Tonkin and Reid Hwy’s (Figure 9 Appendix). Cluster Number 5: This cluster has construction and landscaping as the 2 top venues in all suburbs [10]. (11 July)
Housing Price data from RealEstate.com.au on the 2 JULY 2021
Figure 6 is simply the first 7 rows of the Pandas data frame with the housing price data. Linear regression gave extremely low R^2 (0.24) values when plotting house prices based on approximate distance from the coast, North and South of the Swan River and distance from the Perth CBD. For instance, in the Midland Delivery area, Midland has the lowest mean house price of all the suburbs in Perth, but it is surrounded by far more affluent suburbs. The most affluent suburb is Cottesloe with a median house price of over 2 million dollars which is on the coast and near the CBD (Figure 7). Traditionally, in Perth they talk about “North and South of the River” North of the River Swan having the more affluent suburbs, this certainly does not seem to be the case in 2021 since “Affluent Suburbs” seem to be equally distributed all over the Greater Perth Metropolitan Area. There are only three suburbs in the whole of Perth (in my n = 79 sampled data set) with an average house price of less than 300000 dollars, Midland, Greenfields in Mandurah and COOLOONGUP in Rockingham. I have driven through Greenfields along Lakes Road many times and it does not look poor all the houses are in good condition. Mandurah, which is a popular city for fly in fly out mining workers (FIFO) has most of the cheaper suburbs being the furthest form the CBD it is also on the coast. Mandurah has some attractive looking suburbs and the most expensive are Wannanup and San Remo with a median house prices of 540000 and 575000 dollars, respectively.
Finally, Perth until the 1950s had a population of less than 400,000 people (~311,000 in 1950), in 2021 the population is 2.125 million mainly because of resources booms, so Perth has gained more than 80% of its population in the last 70 years and there appears to little inner-city decay.
5. Discussion
I stated earlier there are affluent suburbs all over the Perth Greater Metropolitan area. This obviously gives more choice where to start your business or look for jobs. So, the decision on what suburb to live in depends on where you have your business or job, North or South of the river or in the CBD. Costal suburbs North and South appear to be attractive to FIFO workers where there is no daily commuting, and the “cashed up bogans” among them https://en.wiktionary.org/wiki/cashed_up_bogan can indulge during their weeks off. Mandurah and Rockingham are popular with there cheaper housing. Mandurah in particular, which is close to the southwestern part of WA and the world-famous Margaret River Wine Region https://en.wikipedia.org/wiki/Margaret_River_(wine_region), where some FIFO workers choose to live anyway. Rockingham’s most famous cashed up bogan. https://en.wikipedia.org/wiki/Sam_Worthington’
Those people who do not want to live in the more expensive costal suburbs or near the CBD still have plenty of choice. The Ellenbrook/Aveley/The Vines area is excellent choice, as stated earlier the road transportation system is excellent in this area with the upgrades to the Tonkin and Reid Hwy’s give rapid transport to everywhere else. The area is close to the Swan Valley wineries and boutique restaurants and food outlets.
In the results section I talked about suburbs with liquor stores in the top 10 venues, in an area such as greater Perth with lots of desirable suburbs negative factors can be used to eliminate some suburbs from consideration. For instance, I ran the K-means clustering program on consecutive days and some suburbs came up twice with a liquor store in the top 10 venues. These suburbs were Mount Pleasant, which came up twice with a liquor store as the top venue, Pinjarra, Gosnells, Forrestfield, Melville, High Wycombe, Gooseberry Hill, Duncraig, Merriwa, Padbury, Betram, Willagee Central, Beldon and Kelmscott. This also requires further analysis. For instance, are these suburbs full of drunks? Or is there just a popular liquor store on a main thoroughfare through the suburb that have purchases from people just passing through on their way home from work?
Some factors that probably influence the low R^2 score are suburbs in the Darling Scarp such as Kalmunda are elevated and have views over the Swan Plain resulting in higher medium house prices despite being a long way from the coast and Perth CBD. In addition, lifestyle blocks on the fringes of Perth such as Serpentine, which is also more than 20 Km from the coast, also effected the result. There are at least two approaches dealing with these issues. The first approach is just to leave the suburbs that are not on the Swan plain out of the regression analysis and don’t include suburbs with lifestyle blocks as well. However, this would leave out some very desirable suburbs that people may be attracted to. The second approach would be to use a different model, some ideas for this would be to have categorical data for “In Darling Scarp, yes or no” and “lifestyle blocks in Suburb yes or no” in some sort of linear multivariate model like the one already tried. Another possibility is to try a more complex polynomial model. Also, a Supervised Machine Learning algorithm may be considered for future analysis, K nearest neighbour for example, since there is a dependant variable in the housing data set. Finally, no area in Perth is particularly safe from severe weather such as storms (Appendix, Figure 8) and the leafier areas on the fringes of Perth and the Darling Scrap are susceptible to bush fires. Insurance……..
6. Conclusions
There is a lot of choice in the Greater Perth Metropolitan area on where to live and work and where to start a business since affluent suburbs are spread throughout the Perth area. For people with greater resources the more central suburbs closer to the CBD and coast with more amenities are recommended; and if your job or business is North or South of the Swan River, your place of residence should be as well. Fly in fly out workers have the greatest choice on where to live. People who work in the CBD have more choice where to live because of multiple modes of transport. Suburbs with liquor stores as the top venue such as Mount Pleasant and Pinjarra should be scrutinized before a decision is made to live there. These choices should also be evaluated against the harsh Western Australian climate and fauna. Bush clad suburbs such as those on the fringes of Perth and in the Darling Scarp are susceptible to bushfires during the November to April period, Insurance is essential. Nowhere in Perth is safe from severe storms and snakes warning signs on beaches and elsewhere should be taken very seriously since many species can deliver a deadly bite.
There is plenty of scope for further analysis since unsupervised K-means clustering is one of the easiest machine learning techniques to implement. The house price data available can be analysed as a dependant variable predicted by features such as distance from the coast and the CBD, which provides for a supervised machine learning clustering technique to be implemented. In addition, a more sophisticated regression analyses that was used here can be tested to improve the low R^2 value (0.24) that was achieved with a multiple linear regression model with two features or independent variables. Finally, Perth is one of the most isolated Capital Cities in the World. This is good to avoid COVID-19 but bad if you want your relatives and friends to visit you or you visit them.
7. References
Links
List of WA government agencies
Chamber of Commerce and Industry WA
Mining and Energy Companies in Perth and WA
Abattoir’s in Western Australia
Trip Advisor Resorts in Perth and Western Australia
Backpackers in Western Australia
Backpacker Jobs in Perth and WA
Top 20 Perth Development Projects
New Residential Housing Subdivisions
Infrastructure, Commercial Real Estate and Businesses for Sale
Restaurants and Food Outlets for Sale in Perth
References
[1] Wikipedia, Western Australia https://en.wikipedia.org/wiki/Western_Australia
[2] Wikipedia, Perth https://en.wikipedia.org/wiki/Perth
[3] RealEstate.com.au https://www.realestate.com.au/neighbourhoods/cottesloe-6011-wa
[4] https://www.linkedin.com/pulse/segmenting-clustering-neighborhoods-toronto-battle-dr-kapil-nagwanshi
[5] https://medium.com/analytics-vidhya/exploring-the-neighborhoods-in-toronto-canada-925ff4ffbf71
[6] https://www.corra.com.au/australian-postcode-location-data/
[7] Haversine, https://towardsdatascience.com/heres-how-to-calculate-distance-between-2-geolocations-in-python-93ecab5bbba4
[9] Foursquare Application Programming Interface (API) https://developer.foursquare.com/
8. Appendix

Figure 8. Tree falling on an insured car after a storm May 14th 2021 (nobody hurt).
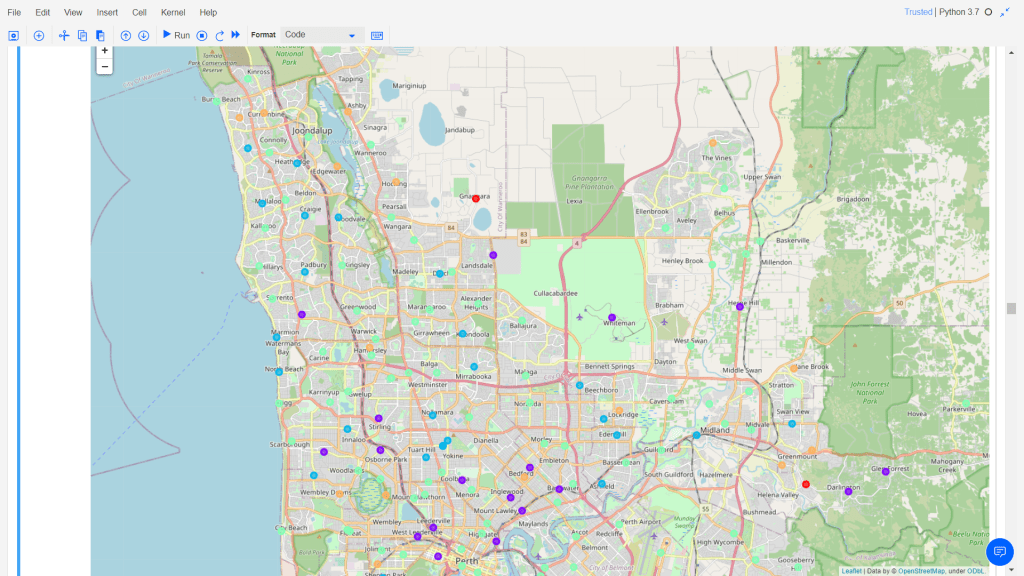
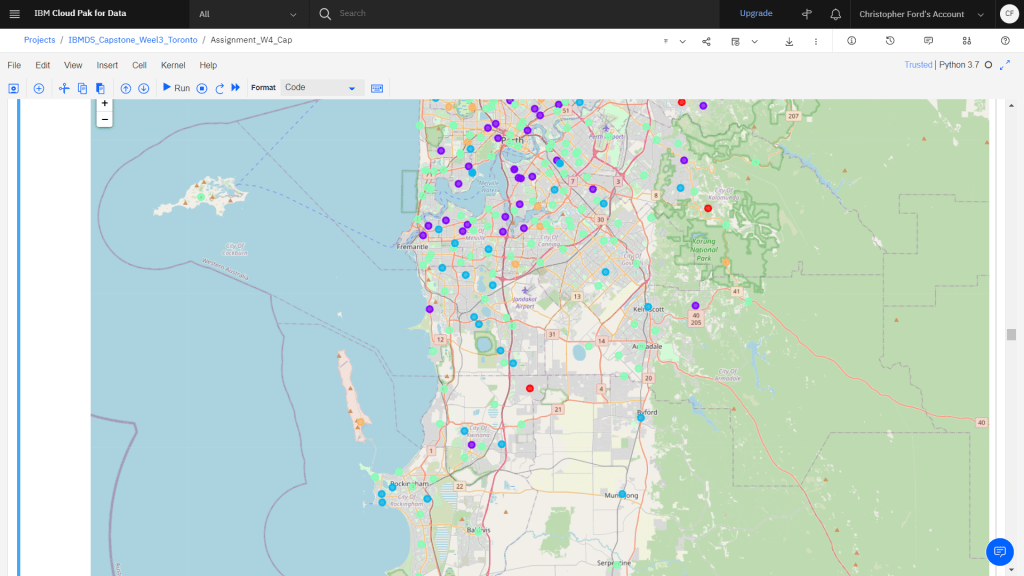
Figure 9: K-means clustering, K= 5, North and South of the Swan River
THE END

Lots of good data. Thanks for sharing.
LikeLike